In Part I of the two part series, I had talked a little bit about the cool things that can be done with the Excel add on called PowerPivot, with the data feed coming in from a crm 2011 organization. In Part II, we are going to dive in to Power View, which is a browser-based Silverlight application launched from SharePoint that enables users to present and share insights through interactive presentations.
Power View, a feature of SQL Server 2012 Reporting Services Add-in for Microsoft SharePoint Server 2010 Enterprise Edition, is an interactive data exploration, visualization, and presentation experience. It provides intuitive ad-hoc reporting for business users such as data analysts, business decision makers, and information workers. They can easily create and interact with views of data from data models based on PowerPivot workbooks published in a PowerPivot Gallery, or tabular models deployed to SQL Server 2012 Analysis Services (SSAS) instances.
A Power View report is always presentable. We can browse the data and present it at any time, because we are working with real data. In Power View, we can quickly create a variety of visualizations, from tables and matrices to bubble charts and sets of small multiple charts. It also provides several ways to filter and sort data, along with creating a single report with multiple views.
This link contains excellent information on the new functionality in Power View with SQL Server 2012.
http://blogs.msdn.com/b/sqlrsteamblog/archive/2011/11/17/what-s-new-in-power-view.aspx
Install Power View:
The installation of Power View is way more involved than getting Power Pivot installed as an add on to Excel. It took me a few tries to get the Power View setup going on my server running SharePoint 2010 Enterprise . Here are a couple of great links to get you in the right path.
1. Step by step guide to installing Power View with Power Pivot
2. SQLShorts video on Installing and Configuring PowerPivot and Power View
Import CRM Data:
1. Once the install steps are completed, login to the site just created. You will see a Library called "PowerPivot Gallery"

2. Upload the excel powerpivot file. I am going to use the PowerPivot workbook from Part I of this series that contains crm data. I created the workbook by connecting Excel PowerPivot to the crm data feed and selecting AccountSet, ContactSet and IncidentSet views to import using the Import table wizard.

Create Power View Report:
1. Select the excel file that was imported, and click on the "Create Power View Report" icon on upper right corner.

2. On selecting the Power View Report icon, you will see something similar to the screen shot below. Notice that the data views are to the right, and they contain the AccountSet, ContactSet and IncidentSet views.

3. Once you have the source views, we can then select the data we want to see by pulling it into the table. See screenshots for some sample table/ charts that I created. Once the data visualization process is complete, the user can save the report to sharepoint.
Screenshot below contains list view of Accounts in card format, and number of cases categorized by customer:

Screenshot below contains list view of Accounts in card format, and number of cases categorized by customer and priority.

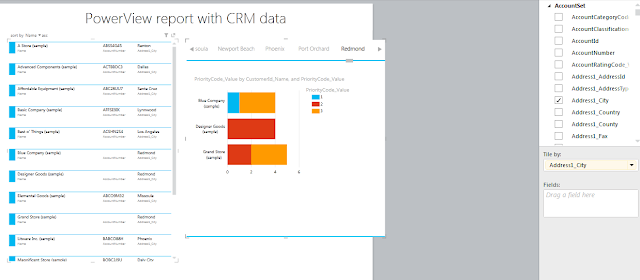
Screenshot below contains list view of Accounts in card format, and number of cases categorized by customer and priority. There is also a filter on the top portion of the chart that lets you filter by City (In the screenshot I have it filtered by city Redmond)
Conclusion:
Screenshots are not going to do justice to Power View, but it was a very nice experience creating the different reports listed above. You see the preview as you make the change, and the filtering capabilities are fantastic.
The data set I use is from the sample data that is available in the CRM system. To understand the full power and capabilities of the Power View report, I would suggest connecting to a database like the Adventure Works sample database available on codeplex (the instructions are in the SQLShorts video), which has enough detail to create a good looking report. Additionally there are quite a bit of tutorials and other videos online that deal specifically with Power View that you can leverage.
If you are running Sharepoint Enterprise Edition with SQL Server 2012 as the backend, Power View enables your Business Analysts to gain deep insight to your CRM data without having to learn coding or write sql queries. Just like Power Pivot, the goal is to make Business Intelligence a self service operation, and Power View is a great way to do it.
Thanks for reading!
Power View, a feature of SQL Server 2012 Reporting Services Add-in for Microsoft SharePoint Server 2010 Enterprise Edition, is an interactive data exploration, visualization, and presentation experience. It provides intuitive ad-hoc reporting for business users such as data analysts, business decision makers, and information workers. They can easily create and interact with views of data from data models based on PowerPivot workbooks published in a PowerPivot Gallery, or tabular models deployed to SQL Server 2012 Analysis Services (SSAS) instances.
A Power View report is always presentable. We can browse the data and present it at any time, because we are working with real data. In Power View, we can quickly create a variety of visualizations, from tables and matrices to bubble charts and sets of small multiple charts. It also provides several ways to filter and sort data, along with creating a single report with multiple views.
This link contains excellent information on the new functionality in Power View with SQL Server 2012.
http://blogs.msdn.com/b/sqlrsteamblog/archive/2011/11/17/what-s-new-in-power-view.aspx
Install Power View:
The installation of Power View is way more involved than getting Power Pivot installed as an add on to Excel. It took me a few tries to get the Power View setup going on my server running SharePoint 2010 Enterprise . Here are a couple of great links to get you in the right path.
1. Step by step guide to installing Power View with Power Pivot
2. SQLShorts video on Installing and Configuring PowerPivot and Power View
Import CRM Data:
1. Once the install steps are completed, login to the site just created. You will see a Library called "PowerPivot Gallery"

2. Upload the excel powerpivot file. I am going to use the PowerPivot workbook from Part I of this series that contains crm data. I created the workbook by connecting Excel PowerPivot to the crm data feed and selecting AccountSet, ContactSet and IncidentSet views to import using the Import table wizard.

Create Power View Report:
1. Select the excel file that was imported, and click on the "Create Power View Report" icon on upper right corner.

2. On selecting the Power View Report icon, you will see something similar to the screen shot below. Notice that the data views are to the right, and they contain the AccountSet, ContactSet and IncidentSet views.

3. Once you have the source views, we can then select the data we want to see by pulling it into the table. See screenshots for some sample table/ charts that I created. Once the data visualization process is complete, the user can save the report to sharepoint.
Screenshot below contains list view of Accounts in card format, and number of cases categorized by customer:

Screenshot below contains list view of Accounts in card format, and number of cases categorized by customer and priority.

Screenshot below contains list view of Accounts in card format, and number of cases categorized by customer and priority. There is also a filter on the top portion of the chart that lets you filter by City (In the screenshot I have it filtered by city Redmond)

Conclusion:
Screenshots are not going to do justice to Power View, but it was a very nice experience creating the different reports listed above. You see the preview as you make the change, and the filtering capabilities are fantastic.
The data set I use is from the sample data that is available in the CRM system. To understand the full power and capabilities of the Power View report, I would suggest connecting to a database like the Adventure Works sample database available on codeplex (the instructions are in the SQLShorts video), which has enough detail to create a good looking report. Additionally there are quite a bit of tutorials and other videos online that deal specifically with Power View that you can leverage.
If you are running Sharepoint Enterprise Edition with SQL Server 2012 as the backend, Power View enables your Business Analysts to gain deep insight to your CRM data without having to learn coding or write sql queries. Just like Power Pivot, the goal is to make Business Intelligence a self service operation, and Power View is a great way to do it.
Thanks for reading!
No comments:
Post a Comment